> For the complete documentation index, see [llms.txt](https://docs.viperexecution.com/llms.txt). Markdown versions of documentation pages are available by appending `.md` to page URLs; this page is available as [Markdown](https://docs.viperexecution.com/research/whale-positions-execution-costs.md).
# What 18 Whale Positions Reveal About Crypto Execution Costs
Entry fills for 18 large Hyperliquid positions, reconstructed wallet by wallet: about $187,000 in fees that passive maker execution avoids.
**April 2026 · Public**
Last month we published a piece on why event-driven, liquidity-driven execution structurally outperforms the time-driven approaches that dominate crypto trading infrastructure. The argument was framework-level — the case for *why* the paradigm shift matters.
This piece puts numbers behind the framework. Using our internal screening framework, we identified large open positions on Hyperliquid, reconstructed the entry fill history wallet-by-wallet, and measured what each trader actually paid in execution costs versus what they would have paid using passive, maker-rebate execution.
The headline finding: **across 18 large open positions where entry data could be verified in full, traders paid approximately $187,286 more in entry-period exchange fees than necessary** — measured purely against passive maker execution, with no consideration of market impact or signaling effects.
***
## Scope and Data Integrity
The positions discussed below are a curated cross-section drawn from the broader universe of large open Hyperliquid positions — not a complete census. We apply a strict filter for data integrity: a position only enters the analysis if we can verify that every entry fill contributing to the current position was captured in our reconstruction, back to position-open. Where that standard cannot be met — because fills extend beyond any practical lookback window, or because the wallet's trading activity is too dense to deterministically reconstruct — the position is excluded.
{% hint style="info" %}
This is deliberately conservative. The pattern described here — taker-heavy execution by large traders — is prevalent across many more positions than are shown. We do not data-mine for worst cases or optimize for headline numbers: inclusion depends on data completeness first, and observable signal second. There are larger positions in the market than the ones in this analysis; we will not report figures on data we cannot fully verify.
{% endhint %}
This phase of the analysis is restricted to Hyperliquid's native perpetual markets. HIP-3 instruments — the Hyperliquid-Permissioned instruments covering equities (including blue-chip US names and indices like the S\&P 500), commodities, and FX — are excluded from this round. Their fee structures differ from native perps and warrant separate treatment. With the recent expansion of HIP-3 markets on Hyperliquid in partnership with TradeXYZ, institutional demand for execution across these instruments has increased materially; Viper's six execution algorithms already operate across HIP-3 markets, and a companion analysis covering these instruments will follow.
***
## What We Measured
For each qualifying position we measured three things and derived a fourth.
**Actual blended cost.** Every entry fill was classified as maker or taker. The trader's effective execution cost in basis points is the notional-weighted blend of their HL maker and taker fee rates, applied to the split between maker and taker fill volume. This is deliberately notional-weighted rather than count-weighted — a count-based maker percentage is easily skewed by many small maker fills offsetting a few large taker sweeps, and the economic reality is the volume-weighted number.
**Per-wallet fee tier.** Hyperliquid fees vary by trader based on 14-day rolling volume, staking discounts, and referral discounts. We used each wallet's actual effective fee tier rather than a generic base-rate assumption. This materially affects the analysis: a VIP-3 trader's maker rate differs from a Base trader's maker rate by an order of magnitude, and a fair comparison against GlideMaker must use the same per-wallet tier on both sides.
**Viper cost under GlideMaker.** Same fee tier — HL charges what it charges, regardless of how trades are routed. Same maker/taker rate structure. What differs is the execution profile. [GlideMaker](/algorithms/glidemaker.md), as a post-only passive algorithm, consistently achieves 99% or higher maker execution in production. We use **95% maker** in this analysis as a conservative benchmark, with the Viper builder fee of **0.80 bps** added on top.
**Savings.** `actual_cost − viper_cost`, applied to total entry notional. This deliberately uses entry notional rather than current position notional, since the savings would have accrued at the time of execution.
We restricted the analysis to GlideMaker because it is the cleanest single-algorithm comparison. [Pacemaker](/algorithms/pacemaker.md) — Viper's adaptive TWAP — typically runs around 85% maker in our internal testing; under that profile, aggregate savings across the same 18 positions would be $153,515. [GhostSweep](/algorithms/ghostsweep.md), designed for stealth large-size execution, is excluded entirely. Its value is in market impact reduction rather than maker rebate capture, and requires a separate measurement framework.
***
## Headline Numbers
| Metric | Value |
| ------------------------------------------------------- | -------------- |
| Positions included | 18 |
| Total current notional | $403,901,479 |
| Total entry notional | $1,123,768,594 |
| Aggregate entry-period savings (GlideMaker @ 95% maker) | **$187,286** |
| Average savings per position | $10,405 |
| Maximum single-position savings | $106,174 |
The savings distribution is skewed: one position accounts for 57% of the total. The remaining 17 positions cluster between $400 and $26,000. This is not unusual — large active traders with high churn rates accumulate fee differentials faster than infrequent position-builders. We address that position specifically below.
***
## The Leaderboard
All values: GlideMaker @ 95% maker × 0.80 bps builder fee, against the wallet's actual HL fee tier.
| # | Wallet | Coin | Side | Notional | Maker % | HL Tier | Their → Viper | Savings |
| -- | --------------- | ---- | ----- | -------: | ------: | ------- | --------------- | -----------: |
| 1 | 0x535e34...3867 | ETH | LONG | $16.2M | 7.3% | VIP-3 | 2.81 → 1.33 bps | **$106,174** |
| 2 | 0x94d373...3814 | BTC | SHORT | $73.9M | 12.8% | VIP-3 | 2.67 → 1.33 bps | **$26,178** |
| 3 | 0xd62d48...7d91 | BTC | SHORT | $20.9M | 0.0% | Base | 4.50 → 2.45 bps | $6,758 |
| 4 | 0xcab59c...6e6e | BTC | LONG | $18.4M | 0.0% | VIP-4 | 2.80 → 0.94 bps | $5,488 |
| 5 | 0x06bc59...fb72 | ETH | SHORT | $15.6M | 0.0% | VIP-2 | 3.50 → 1.74 bps | $5,250 |
| 6 | 0x8ea85c...edbc | BTC | LONG | $35.9M | 14.8% | VIP-1 | 3.59 → 2.14 bps | $5,231 |
| 7 | 0xa1830e...0482 | BTC | LONG | $44.8M | 33.4% | VIP-1 | 3.06 → 2.14 bps | $4,141 |
| 8 | 0xed41a1...6029 | ETH | SHORT | $26.3M | 0.0% | VIP-2 | 3.20 → 1.87 bps | $3,798 |
| 9 | 0x049bdc...5e7d | ETH | LONG | $20.0M | 0.3% | VIP-4 | 2.79 → 0.94 bps | $3,703 |
| 10 | 0x049bdc...5e7d | BTC | LONG | $20.0M | 0.5% | VIP-4 | 2.79 → 0.94 bps | $3,692 |
| 11 | 0x666688...23f5 | HYPE | LONG | $17.9M | 1.3% | Base | 4.46 → 2.45 bps | $3,611 |
| 12 | 0xa9b95f...3bbd | HYPE | LONG | $19.0M | 0.2% | VIP-2 | 3.50 → 1.74 bps | $3,346 |
| 13 | 0xa9b95f...3bbd | BTC | SHORT | $18.1M | 0.0% | VIP-2 | 3.50 → 1.74 bps | $3,195 |
| 14 | 0xefffa3...fa91 | AVAX | LONG | $14.5M | 7.2% | VIP-1 | 3.64 → 2.20 bps | $2,083 |
| 15 | 0x4f9b09...2e3f | HYPE | LONG | $8.5M | 10.6% | Base | 4.18 → 2.45 bps | $1,915 |
| 16 | 0x0b00c5...9798 | ETH | SHORT | $23.3M | 46.8% | Base | 3.10 → 2.45 bps | $1,632 |
| 17 | 0xa6ee1e...5078 | HYPE | LONG | $9.2M | 37.5% | VIP-5 | 1.72 → 1.25 bps | $692 |
| 18 | 0xa9b95f...3bbd | ETH | SHORT | $2.3M | 0.0% | VIP-2 | 3.50 → 1.74 bps | $397 |
***
## Spotlight: Position #1
`0x535e34...3867` is currently long $16.2M of ETH at HL VIP-3. The position was opened in late November 2025. What makes the savings number so large is the trader's volume profile: they have moved over **$717 million in entry notional** over the position's lifetime — a 44× ratio of entry volume to current size. This is a high-frequency active trader, not a buy-and-hold whale.
At 7.3% maker execution and 92.7% taker, their blended cost has been 2.81 bps. Across $717M in entry volume, that comes to approximately $201,560 in cumulative HL exchange fees on this single position alone.
GlideMaker, executing the same flow at 95% maker, would cost 1.33 bps — saving approximately 1.48 bps per dollar of entry notional. Across $717M in churn, that compounds to **$106,174**.
{% hint style="info" %}
This pattern — low maker execution at high churn rates — is exactly where passive execution algorithms produce the most value. The trader is not necessarily executing badly; they may simply be using time-based or speed-prioritized tooling that does not pursue maker rebates. The cost of that choice is measurable.
{% endhint %}
***
## Spotlight: Position #2
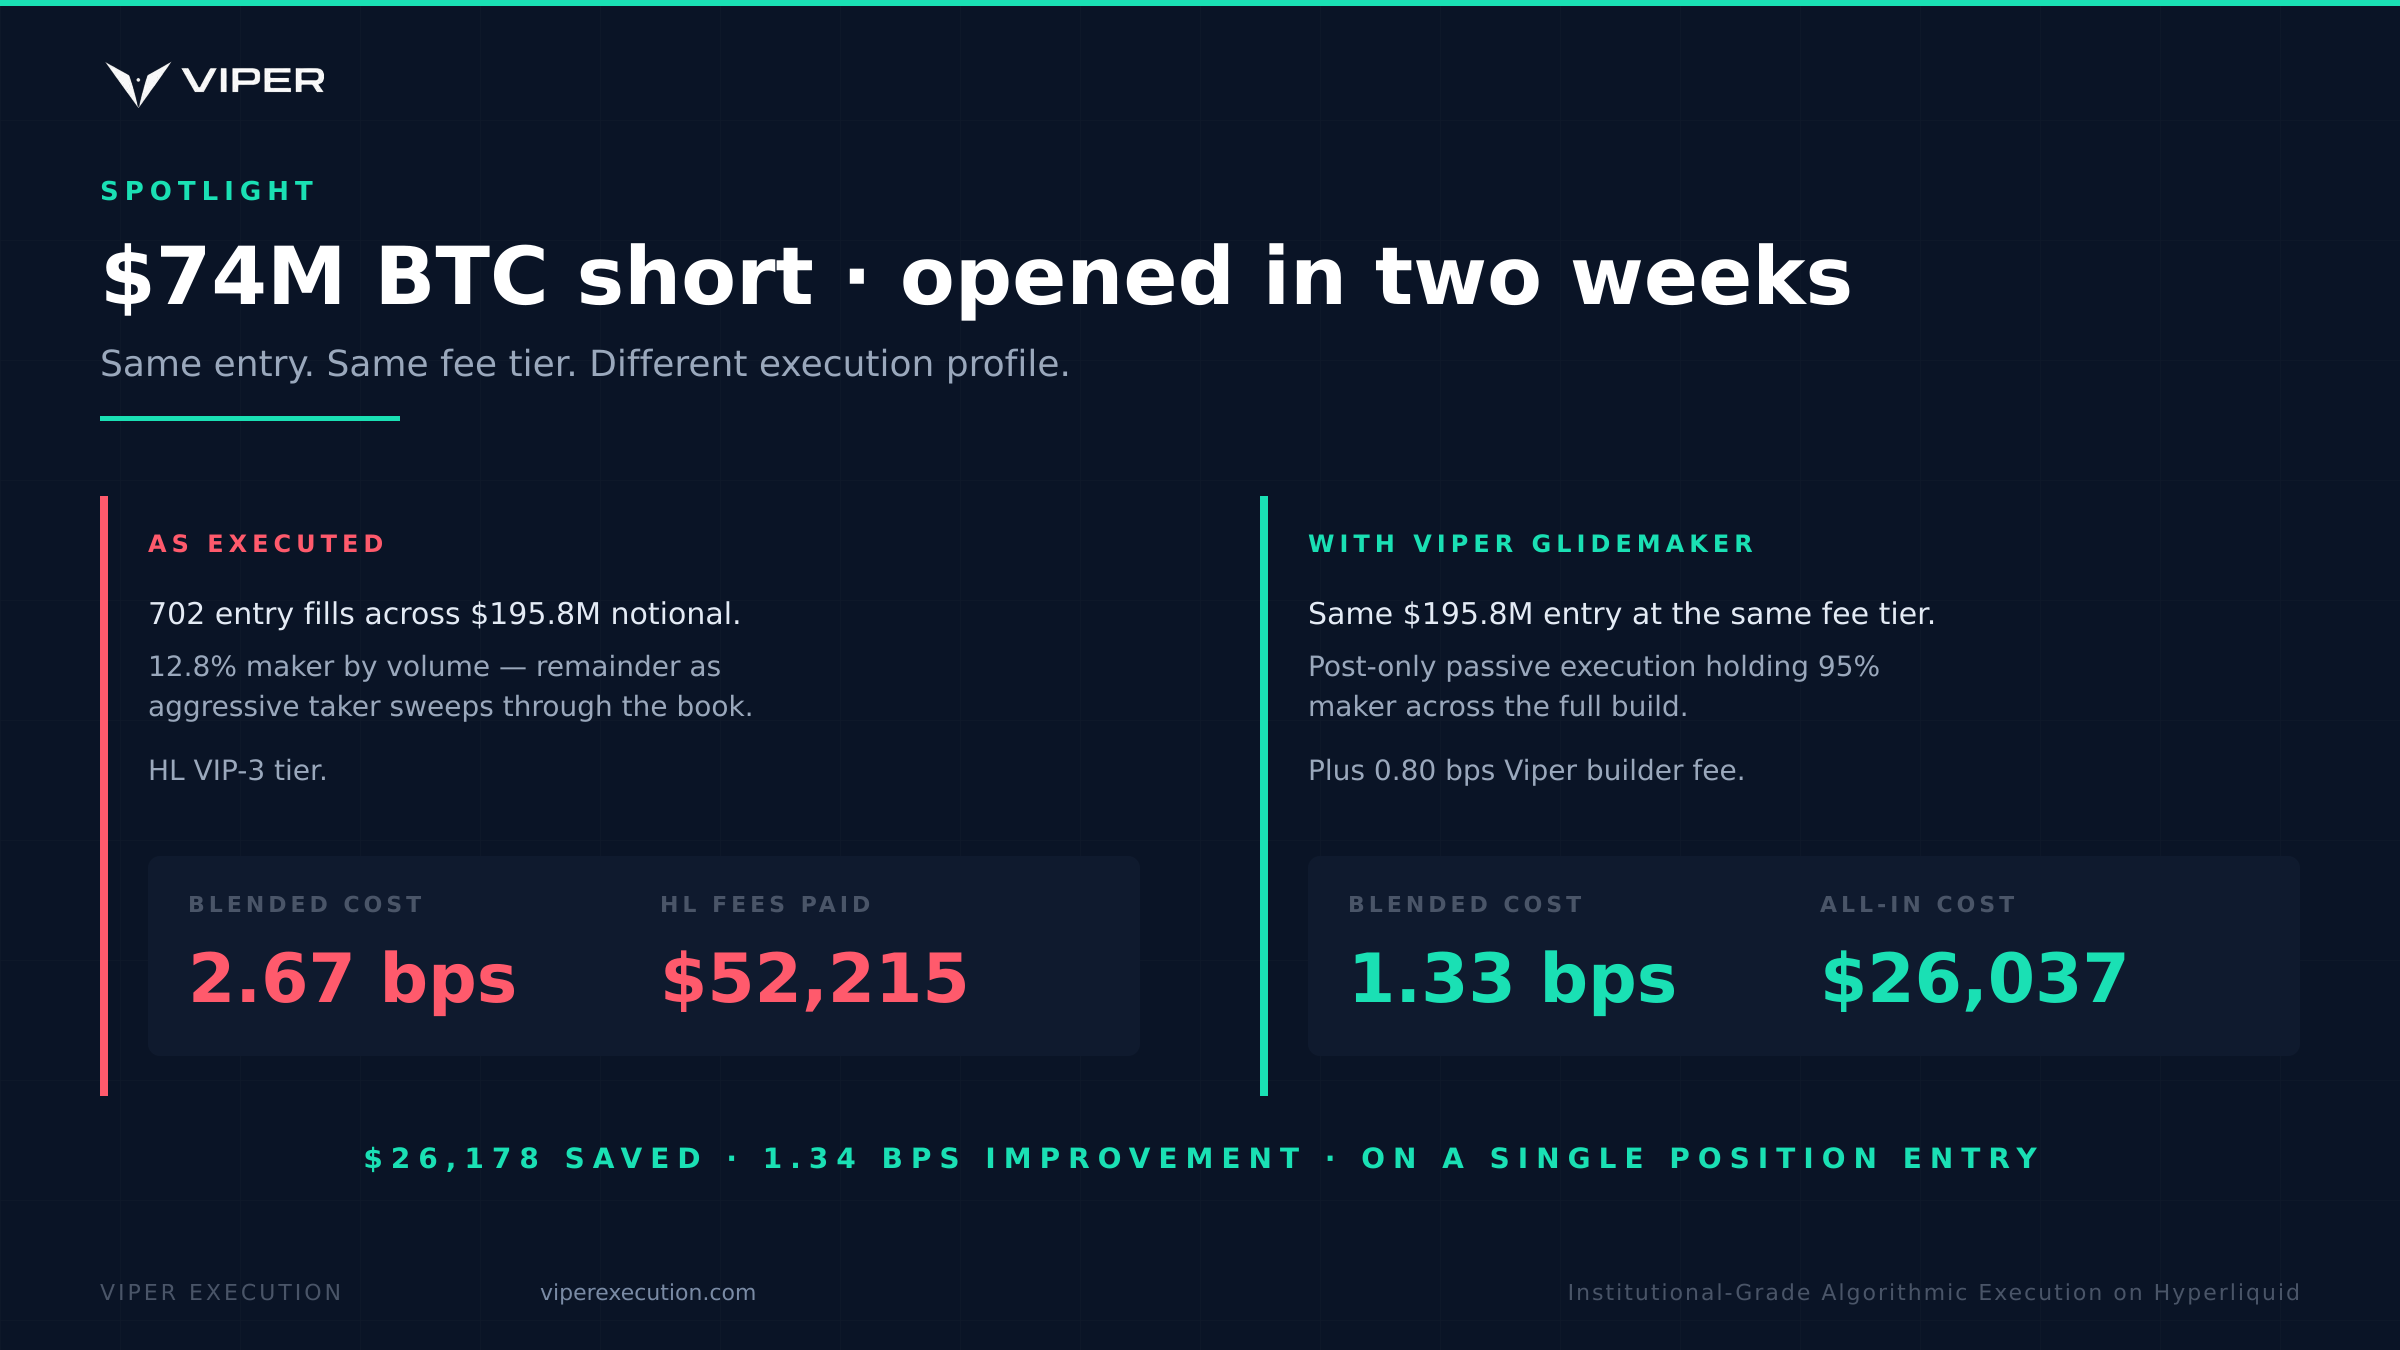
`0x94d373...3814` is a cleaner narrative example: a $74M BTC short opened in late March 2026. At HL VIP-3, the trader paid 2.67 bps blended (12.8% maker), executing $195.8M in entries to build the position. At GlideMaker's 95% maker, the same execution would have cost 1.33 bps — a savings of **$26,178** on the entry alone.
Unlike the position above, this trader has not churned. The savings reflects the cost of taker-heavy entry execution on a single, large position-build over roughly two weeks.
***
## What These Numbers Do Not Include
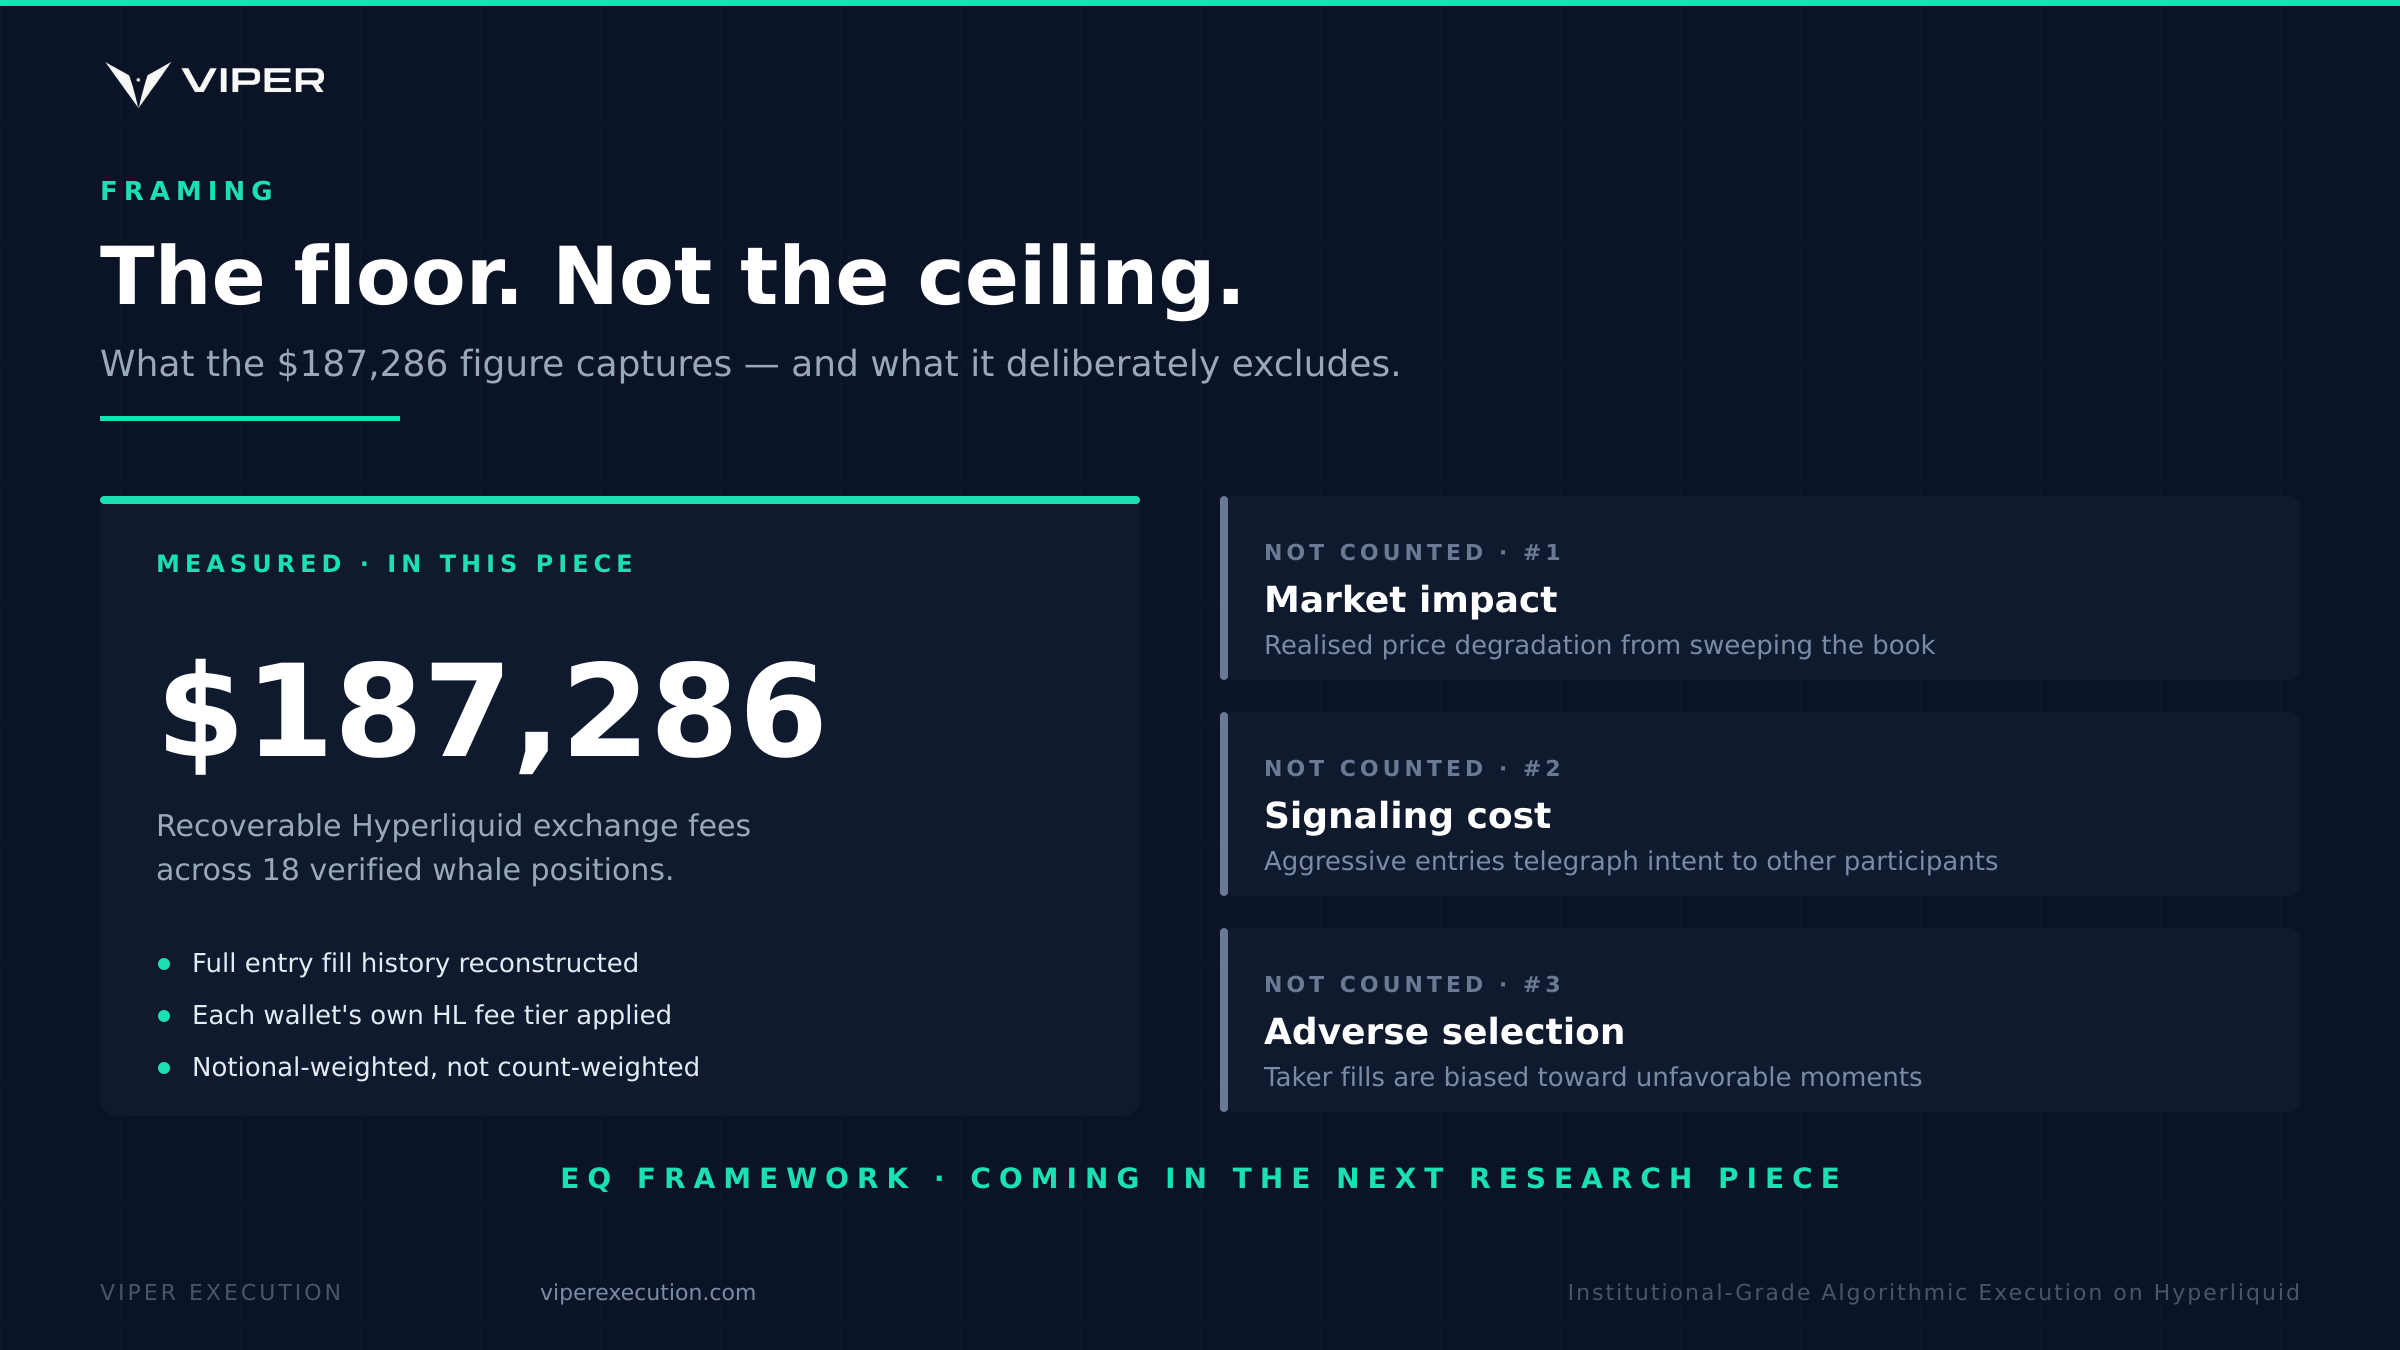
The savings reported here capture only the differential in Hyperliquid exchange fees. Three categories of cost are explicitly excluded:
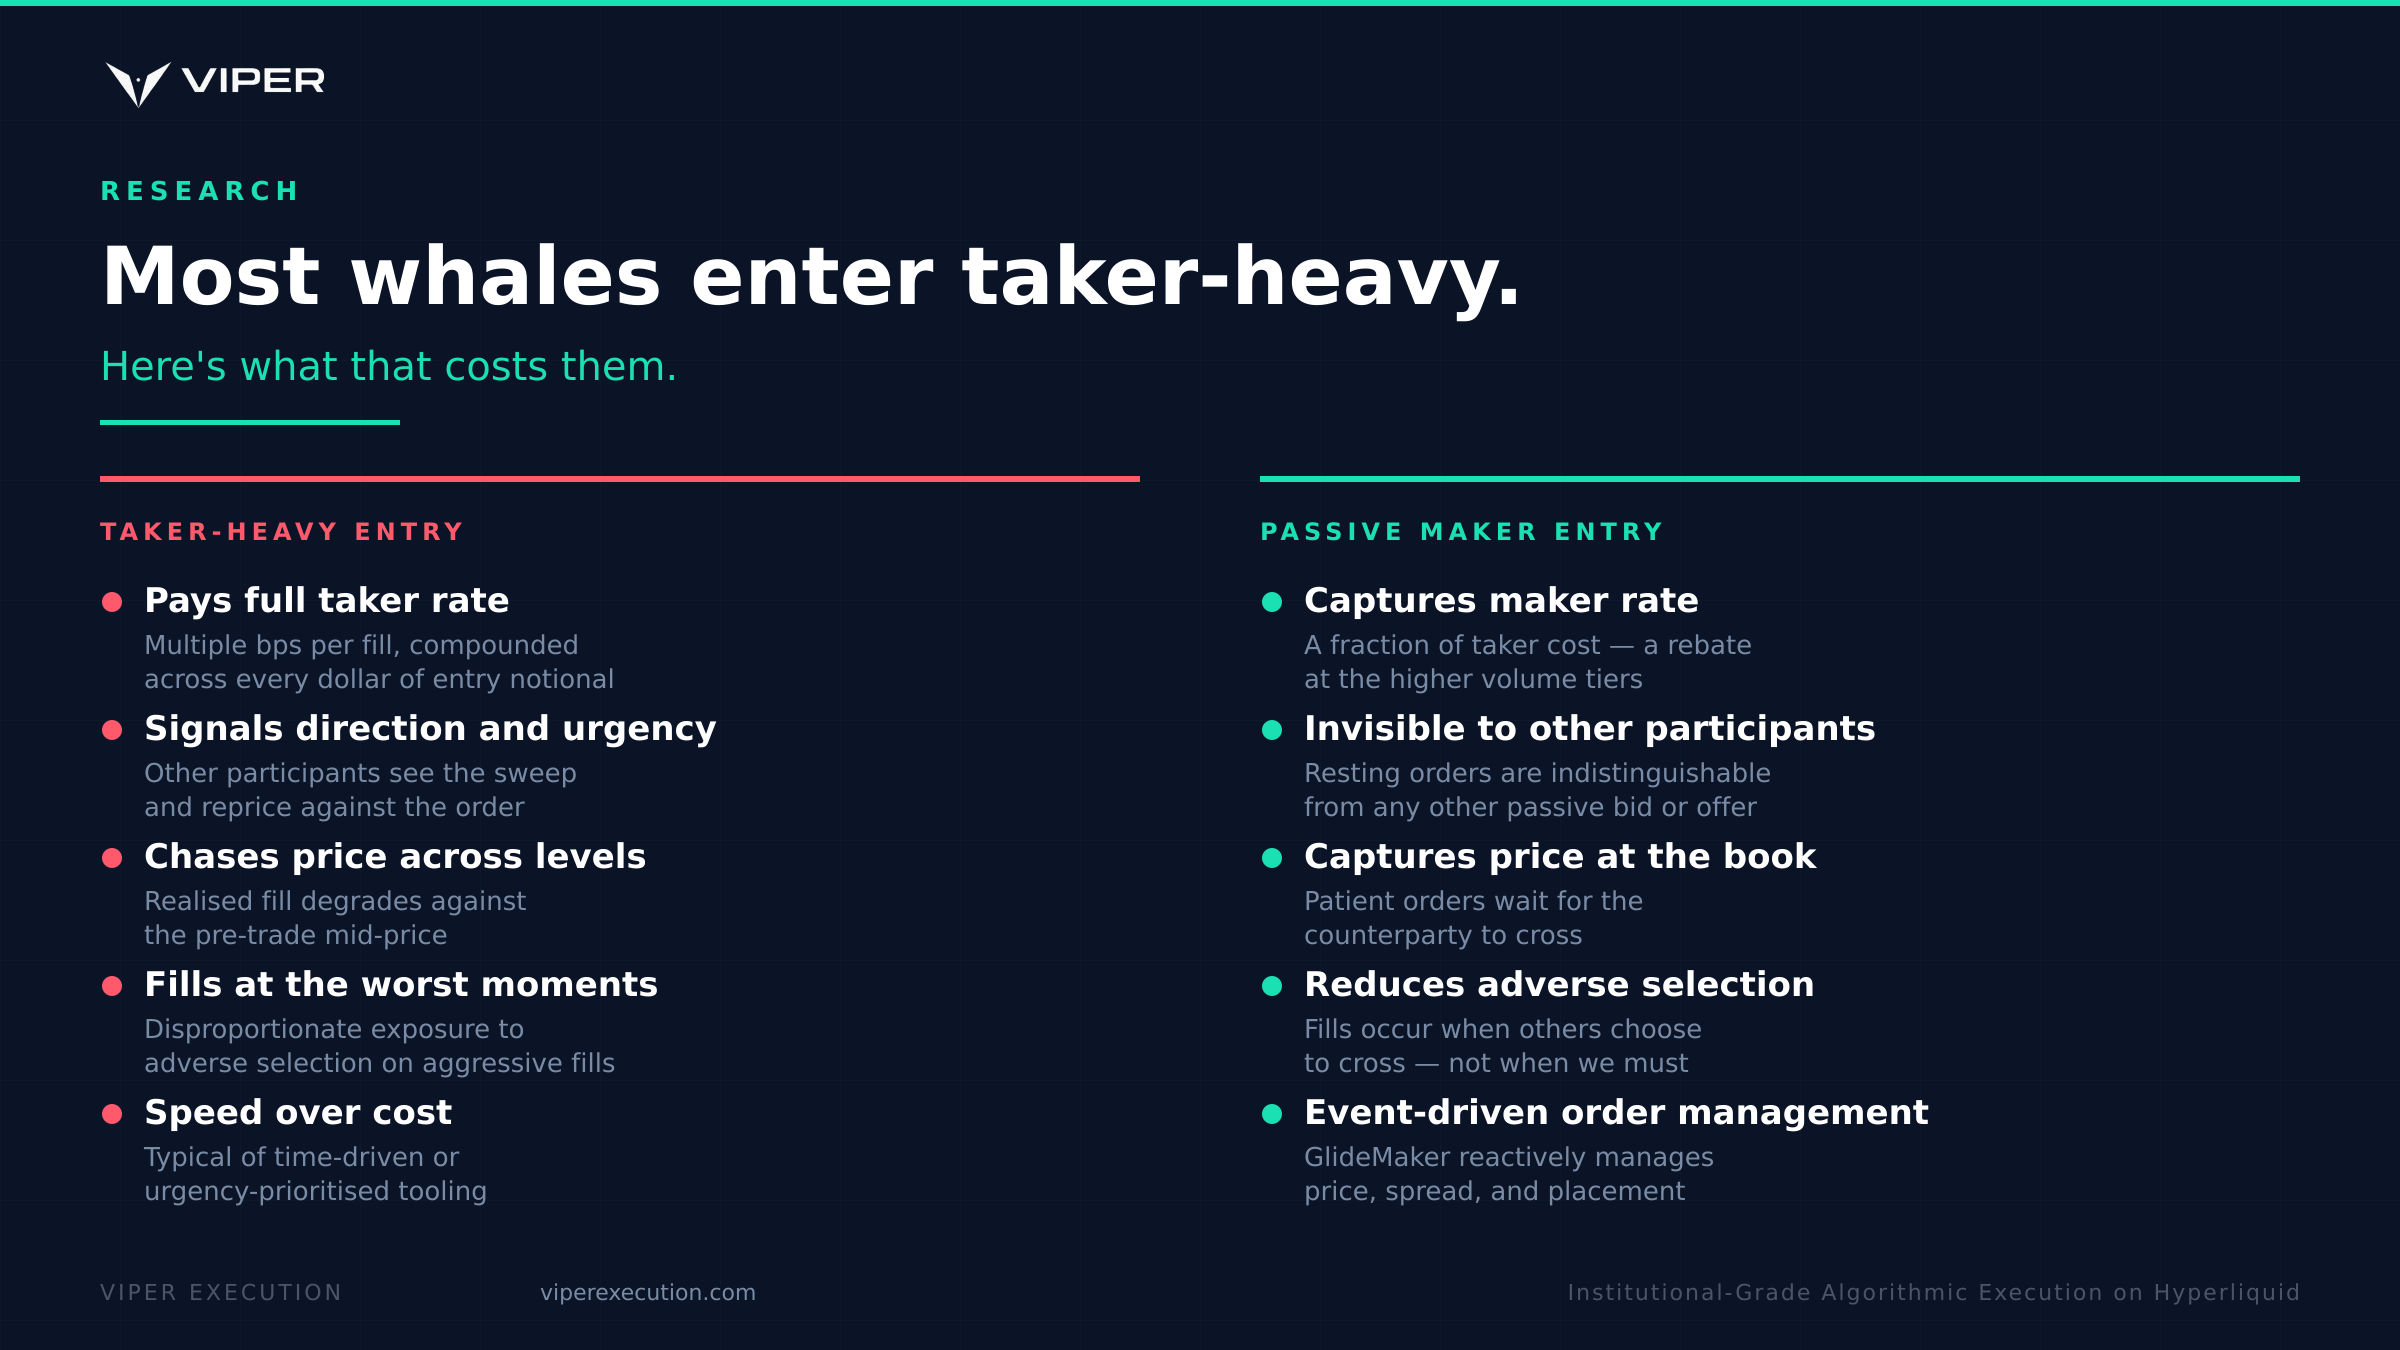
**Market impact.** When a trader sweeps the book to enter a position, the realized fill price degrades against the pre-trade mid-price. This slippage is invisible in fee data but real in P\&L. Maker execution avoids this entirely — limit orders capture price rather than chase it. We will quantify this separately in our forthcoming piece on Execution Quality (EQ) metrics.
**Signaling.** Aggressive taker execution telegraphs intent to other market participants. A trader sweeping $20M in BTC announces both their direction and their urgency. Maker execution sits passively in the book, indistinguishable from any other resting order. The cost of signaling is hard to attribute to any single trade but compounds across a strategy.
**Adverse selection on aggressive fills.** Taker fills are disproportionately likely to be adversely selected — you are most likely to get filled aggressively at exactly the moments you would prefer not to be. This is the inverse of the maker rebate: you pay both the spread and the information cost.
{% hint style="warning" %}
The $187,286 figure should be read as a floor, not a ceiling. The full economic case for liquidity-driven, maker-heavy execution is meaningfully larger than the fee-only differential.
{% endhint %}
***
## What Comes Next
We are publishing our Execution Quality (EQ) framework over the coming weeks — the metrics Viper uses to measure execution against external benchmarks, decompose fee contributions, and quantify the components excluded from this analysis. EQ extends what this piece measures from *"what did you pay HL?"* to *"what did you pay relative to optimal?"*
A companion analysis covering HIP-3 instruments — equities, indices, commodities, and FX — will follow as institutional participation in these markets continues to grow.
If you are managing institutional-scale positions on Hyperliquid and have not measured your actual execution costs against alternative routing, the data to do so exists — your fills are public. We are open to conversations with whale traders, funds, and institutional accounts.
***
*Institutional-grade algorithmic execution on Hyperliquid.*\
[**viperexecution.com**](https://viperexecution.com)